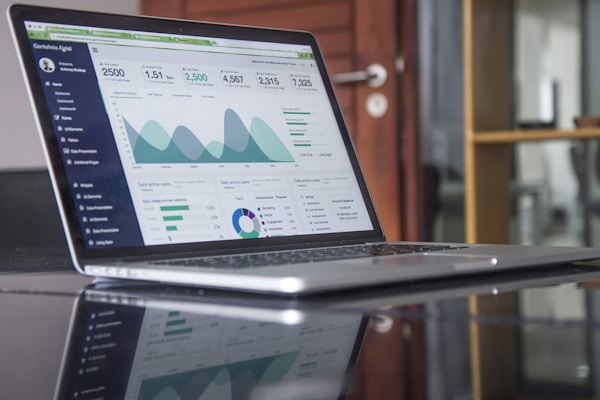
Compare Ad Performance Across Facebook, Instagram, and Google Ads
Stop guessing which platform works best. Get side-by-side analysis, cost estimates, and clear recommendations on where to invest your budget.

Stop guessing which platform works best. Get side-by-side analysis, cost estimates, and clear recommendations on where to invest your budget.

Facebook, Instagram, Google Ads, LinkedIn, TikTok... which platform will give you the best ROI? You're spreading budget thin trying everything.
You're spending on platforms that don't work for your business. Without data, you can't make informed decisions about where to invest.
Each platform reports metrics differently. You can't easily compare Facebook's performance to Google's to make strategic decisions.
Four simple steps to find your best platform
Upload your ad creative and select which platforms you want to compare (Facebook, Instagram, Google Ads).
Our AI analyzes your ad using platform-specific criteria and best practices for each platform.
See scores, strengths, weaknesses, and cost estimates for each platform in one dashboard.
Receive clear guidance on which platform(s) to prioritize and how to allocate your budget.
Comprehensive analysis across all key dimensions
See how your ad scores on each platform using platform-specific grading criteria.
Get predicted CPC, CPM, and CPA for each platform based on your ad quality and industry.
See which platform's audience best matches your target demographic and intent.
Understand which ad formats work best on each platform for your creative.
Identify what works well and what needs improvement for each platform.
See how each platform performs for your industry compared to competitors.
Identify which platforms aren't working and reallocate budget to winners. Save 30-40% on wasted spend.
Stop guessing. Use concrete data to decide where to invest your advertising budget.
Get platform-specific recommendations to improve performance on each channel.
Discover which platform delivers the best ROI for your specific business and audience.
Get recommended budget splits based on platform performance. "Invest 60% in Facebook, 30% in Google, 10% in Instagram."
Learn why ads perform differently on each platform and how to adapt your creative accordingly.
Best For: B2C, E-commerce, Local Business
Best For: Visual Brands, Fashion, Lifestyle
Best For: High-Intent, B2B, Services
Best For: Retargeting, Brand Awareness
LinkedIn Ads and TikTok Ads comparison coming Q2 2025!

Running ads on multiple platforms and need to optimize budget allocation.

Advise clients on which platforms to invest in based on data, not opinions.

Just starting out and need to know which platform to focus on first.

Need to maximize ROI by investing in the right platforms.
"Platform comparison showed us Google Ads wasn't working for our e-commerce brand. We moved that budget to Facebook and saved $8K/month in wasted spend."
"We were splitting budget 50/50 across platforms. Comparison data showed us to go 80/20 Facebook/Google. ROI increased 2.3x in one month."
"As a new advertiser, platform comparison saved us from wasting months testing. We started with Instagram and it was perfect for our brand."
All plans include platform comparison. Upgrade for cost estimates and historical data.
Currently, you can compare Facebook Ads, Instagram Ads, and Google Ads (both Search and Display). LinkedIn Ads and TikTok Ads comparison are coming in Q2 2025. Each platform has unique scoring criteria based on platform-specific best practices and performance data.
Upload the same ad creative and select which platforms you want to compare. We'll grade each version using platform-specific criteria (Facebook has different best practices than Google). You'll see side-by-side scores, strengths/weaknesses for each platform, cost estimates, and specific recommendations for optimization.
Yes! Compare image ads, video ads, carousel ads, and story ads across platforms. We analyze how each format performs on each platform and recommend the best format-platform combinations for your specific goals and audience.
Pro and Enterprise plans include predicted CPC, CPM, and CPA estimates for each platform based on your ad quality, industry, and targeting. This helps you budget effectively and understand the true cost of advertising on each platform before you spend.
Yes! Pro and Enterprise plans include historical platform comparison. See how your Facebook ads have performed vs Google Ads over the past 3, 6, or 12 months. Identify which platform is trending up or down, and make strategic decisions based on long-term data.
Yes! Comparisons include industry benchmarks showing which platforms typically perform best for your specific industry. For example, B2B SaaS often performs better on LinkedIn and Google Search, while e-commerce brands typically excel on Facebook and Instagram. We provide industry-specific recommendations.
Absolutely! Export side-by-side comparison reports as PDF (for presentations) or CSV (for analysis). Reports include scores, recommendations, cost estimates, platform-specific insights, and budget allocation suggestions. Perfect for stakeholder presentations or client reports.
Yes! Based on your ad quality, industry, goals, budget, and target audience, we provide a clear recommendation on which platform(s) to prioritize. We also suggest specific budget allocation percentages (e.g., "Invest 60% in Facebook, 30% in Google Search, 10% in Instagram").